top of page


The Graphs
COVID VACCINE TRUTH
SOURCE & DATA
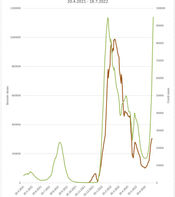
"Rates Per 1M"
(Long press to open in Safari or browser)
DATA SOURCE: "COVID-19 weekly surveillance reports -
Archive - NSW Health"
www.health.nsw.gov.au
Credit to @LCHF_Matt on Twitter
"Rates Per 1M Pt.2"

Full Removed Video
DATA SOURCE: "Daily COVID-19 vaccine doses administered"
www.ourworldindata.org
"Daily new confirmed COVID-19 cases"
www.ourworldindata.org
Credit to @_Naturisti on Twitter
40+ Graphs (Scroll, Download & Share)
Including: United States, European Union, UK, Canada, Japan & more!
"Honorary Part 3 "

Full Removed Video
All Pages & Source Link (Scroll, Download & Share)
These are the documents the US Court ordered Pfizer to release. They tried to hide for the next 75+ years!
DATA SOURCE: Pfizer DATA (Page 30+) "5.3.6 CUMULATIVE ANALYSIS OF POST-AUTHORIZATION ADVERSE EVENT REPORTS OF PF-07302048"
Full PDF --> https://phmpt.org
"Healthy as a Horse "
Full Removed Video

DATA SOURCE: VAERS Data is the OFFICIAL Adverse Event Reporting for the CDC. Studies show there is mass underreporting, so the real numbers are much higher.
Full DATA --> https://openvaers.com
bottom of page


